The report contains the final measurements for each protocol: UDP on 2026-10-12, and other protocols and native coroutine TCP on 2026-10-10. Each protocol retains its own source hash and raw records.
1,620 local IPv4 measurements compare throughput, p99 latency and IO models across the Asio dependency combinations.
Test Conditions
| Configuration | Test machine |
|---|---|
| Machine model | Mac16,11 |
| Processor | Apple M4 Pro |
| Architecture | arm64 |
| Physical / logical CPUs | 14 / 14 |
| Memory | 48 GiB |
| Operating system | macOS 27.0.1 (26A434) |
| Kernel release | 27.0.0 |
Release build; measurement=1.0 s; warmup=0.25 s; repetitions=3.
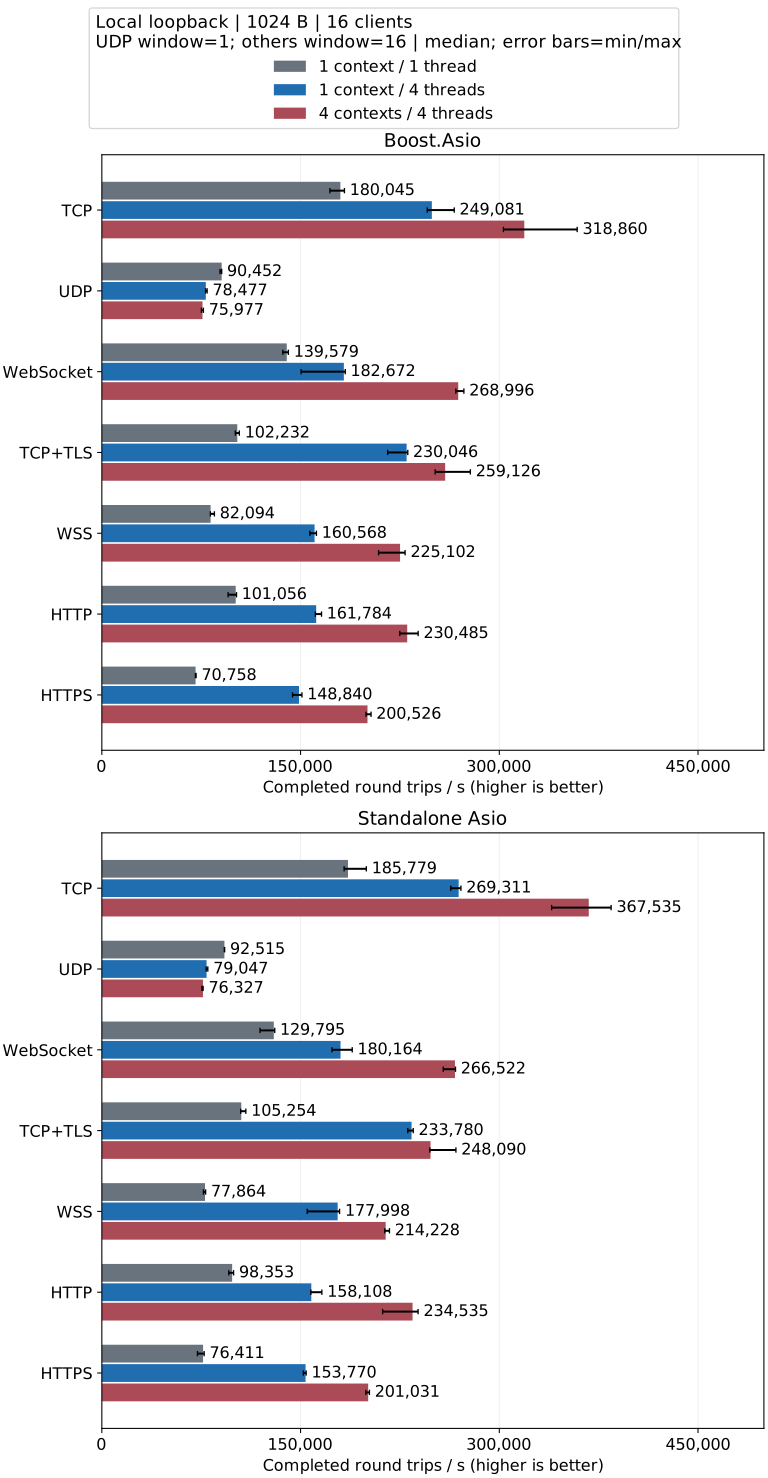
Main charts: 1024 bytes, 16 clients, no added computation. Inflight messages per connection: UDP 1; other protocols 16. Both peers share the process and IO workers over local loopback.
Average process CPU uses 100% for one logical CPU and can exceed 100% with multiple threads; estimated values are labeled, and incomplete sets of three CPU samples show N/A. On this 14-logical-CPU host, machine share = process CPU% / 14; 100% of one CPU is 7.14% of the machine.
Key Results
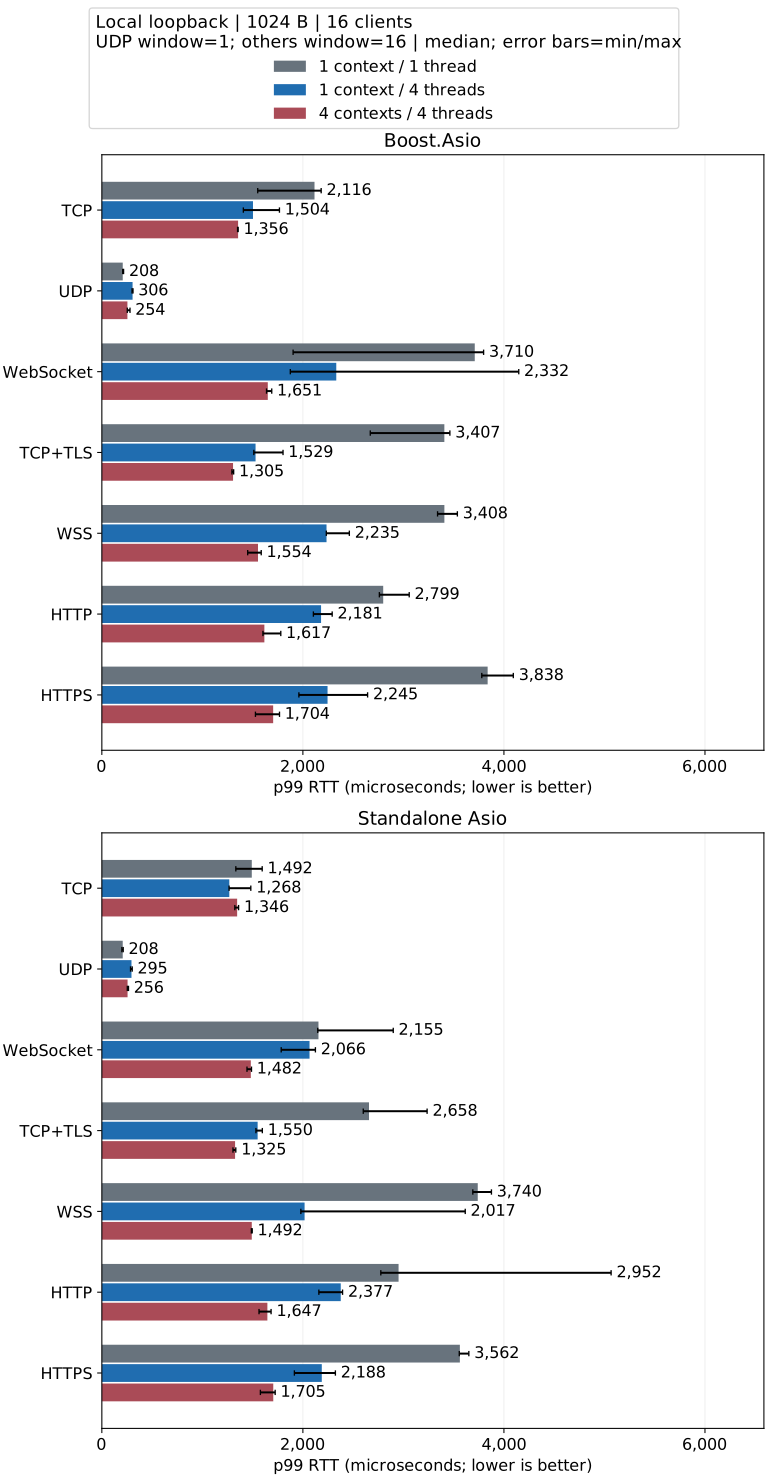
- TCP / Standalone Asio / No added computation: 4 contexts / 4 threads has this group’s highest throughput median (1.98× one thread); its p99 is 1,346.00 us versus 1,491.79 us with one thread.
- UDP / Standalone Asio / No added computation: 1 context / 1 thread has this group’s highest throughput median (92,515 round trips/s), with p99 RTT of 207.79 us and process CPU utilization of 99.4%.
- Coroutine TCP / Standalone Asio / No added computation: 1 context / 4 threads has this group’s highest throughput median (1.84× one thread); its p99 is 870.46 us versus 1,028.71 us with one thread.
- Coroutine TCP / Standalone Asio / 10,000 CPU iterations per echo: 4 contexts / 4 threads has this group’s highest throughput median (3.54× one thread); its p99 is 1,749.29 us versus 5,687.25 us with one thread.
The highest median applies only to the stated load; complete results appear below.
Throughput
p99 Round-Trip Latency
99% of sampled round trips finish within this time; 1000 microseconds = 1 millisecond.
Choosing an IO Model
| Model | Workload | Tradeoff |
|---|---|---|
| 1 context / 1 thread | Low concurrency, control services, light state handling | Long handlers delay every connection |
| 1 context / several threads | Uneven connection activity, shared available workers | Use per-connection strands; shared scheduling has overhead |
| Several contexts / 1 thread each | Partitioned sessions, tenants or stable assignment | A busy shard cannot borrow other shards’ workers |
Coroutine IO and CPU workload comparisons.
Detailed Results by Protocol
Detailed pages retain all 64/1024/16384-byte and 1/16-client profiles. Bars show repeated-run medians; error bars show min/max, not confidence intervals.
All measured values (JSON) | Payload, batch and execution comparisons
Coroutine window=16 measures batch RTT; the callback program measures message RTT. These results do not establish coroutine speedups.
Toolchain and Build
Apple Clang 21.0.0; CMake 4.3.3; Ninja; Release -O3 -DNDEBUG -std=gnu++20 -arch arm64; TLS ON; sanitizers OFF. Standalone Asio 1.38.2 with BHO Beast based on Boost 1.84 (API 351); Boost 1.90.0 with Asio 1.38.0 and Beast API 359; OpenSSL 3.6.4. Mac mini on AC power, low power mode disabled, no CPU affinity.
The dependency combinations use different Beast versions, so differences between them also include dependency-version effects and cannot be attributed solely to Asio.
Metric Definitions
Throughput, RTT, CPU, RSS and error definitions.
Raw Data and Reproduction
-
TCP, TLS, HTTP, WebSocket and native coroutine source SHA-256:
127a500ad7e2fbe4c831cc3ebacc63acac96013e2cb8bf3893d7997ca6ea7f56 -
UDP source SHA-256:
0771574af8ca56f1914deb544b956079e0a2f24021953ded5f5d524e3df334b1; conditions and raw records. -
macmini-m4pro-20261010-boost-coroutine.json: 180 measurements; 2026-10-10T06:22:06.443606+00:00; executable SHA-256
14b22c5832f3d7731294a735d97ab5464cbf64c4efeb439f8f5f4b7576c70df4 -
macmini-m4pro-20261010-boost-http.json: 90 measurements; 2026-10-10T06:08:56.779694+00:00; executable SHA-256
7b2989fd23e15a68a662899d1906f3b094138018b8ada5904309b4a90d96ea34 -
macmini-m4pro-20261010-boost-https.json: 90 measurements; 2026-10-10T06:16:12.072913+00:00; executable SHA-256
7b2989fd23e15a68a662899d1906f3b094138018b8ada5904309b4a90d96ea34 -
macmini-m4pro-20261010-boost-tcp.json: 90 measurements; 2026-10-10T05:31:57.122216+00:00; executable SHA-256
7b2989fd23e15a68a662899d1906f3b094138018b8ada5904309b4a90d96ea34 -
macmini-m4pro-20261010-boost-tcps.json: 90 measurements; 2026-10-10T05:56:20.110867+00:00; executable SHA-256
7b2989fd23e15a68a662899d1906f3b094138018b8ada5904309b4a90d96ea34 -
boost-io.json: 90 UDP measurements.
-
macmini-m4pro-20261010-boost-websocket.json: 90 measurements; 2026-10-10T05:44:16.816290+00:00; executable SHA-256
7b2989fd23e15a68a662899d1906f3b094138018b8ada5904309b4a90d96ea34 -
macmini-m4pro-20261010-boost-wss.json: 90 measurements; 2026-10-10T06:02:39.046046+00:00; executable SHA-256
7b2989fd23e15a68a662899d1906f3b094138018b8ada5904309b4a90d96ea34 -
macmini-m4pro-20261010-standalone-coroutine.json: 180 measurements; 2026-10-10T06:18:15.349061+00:00; executable SHA-256
f2878cefe4ec4259114a9492fa7ac2235deecf797be63735ae51668d7a25b73f -
macmini-m4pro-20261010-standalone-http.json: 90 measurements; 2026-10-10T06:06:57.385745+00:00; executable SHA-256
480122707b4b3ed592d1f580f5cf7092b8008ce52331f55f0e666e89c568be6b -
macmini-m4pro-20261010-standalone-https.json: 90 measurements; 2026-10-10T06:14:08.452400+00:00; executable SHA-256
480122707b4b3ed592d1f580f5cf7092b8008ce52331f55f0e666e89c568be6b -
macmini-m4pro-20261010-standalone-tcp.json: 90 measurements; 2026-10-10T05:29:56.838785+00:00; executable SHA-256
480122707b4b3ed592d1f580f5cf7092b8008ce52331f55f0e666e89c568be6b -
macmini-m4pro-20261010-standalone-tcps.json: 90 measurements; 2026-10-10T05:54:16.794729+00:00; executable SHA-256
480122707b4b3ed592d1f580f5cf7092b8008ce52331f55f0e666e89c568be6b -
standalone-io.json: 90 UDP measurements.
-
macmini-m4pro-20261010-standalone-websocket.json: 90 measurements; 2026-10-10T05:42:15.113877+00:00; executable SHA-256
480122707b4b3ed592d1f580f5cf7092b8008ce52331f55f0e666e89c568be6b -
macmini-m4pro-20261010-standalone-wss.json: 90 measurements; 2026-10-10T06:00:34.943293+00:00; executable SHA-256
480122707b4b3ed592d1f580f5cf7092b8008ce52331f55f0e666e89c568be6b
Scope
Local loopback results do not establish cross-host or production capacity. Short runs, scheduling and thermals introduce variance; repeat with the deployment workload.