The 4 KiB WebSocket case has 6.51% lower median throughput and 13.29% higher P99. Five-run throughput ranges overlap for every configuration; the cause of the differences is unconfirmed. The charts and tables show all other cases.
Each version/configuration uses five fresh processes, with 1 s warmup and 5 s measurement. Baseline and candidate run adjacently with alternating order. All 80 rows are complete, with zero failures, errors or timeouts. Tables show median [minimum–maximum]; ranges are five observations, not confidence intervals.
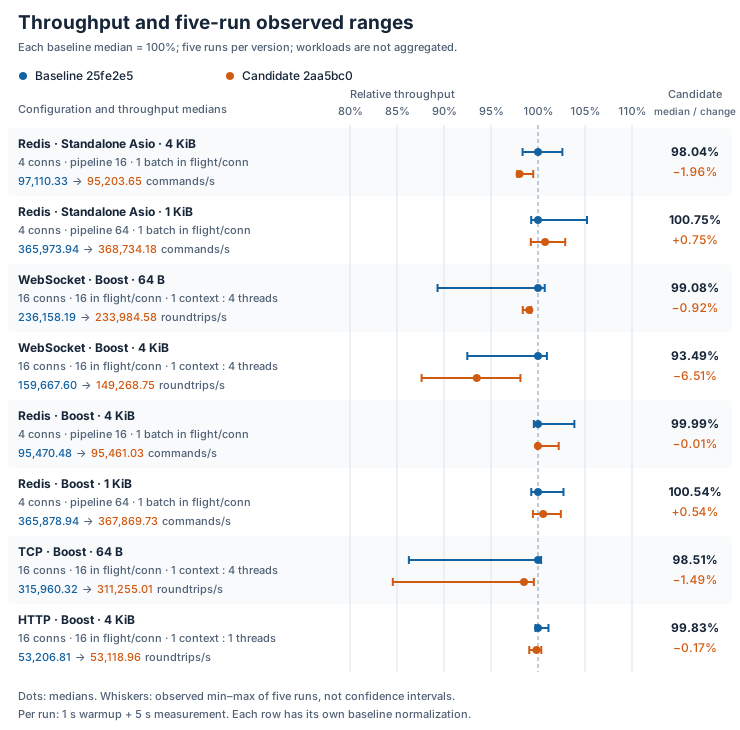
Throughput and CPU
Redis throughput counts thousands of successful commands/s; TCP/HTTP/WebSocket count thousands of message roundtrips/s. Configurations are not added together. One full CPU core is 100%: Redis counts the client process; public endpoints count the colocated client/server process. CPU efficiency is throughput per CPU core, calculated per run before taking the median.
| Configuration | Baseline throughput, k/s | Candidate throughput, k/s | Change | CPU%, baseline → candidate | CPU efficiency change |
|---|---|---|---|---|---|
| Redis · Standalone Asio · 4 KiB pipeline16 · window1 · 4 clients |
97.11 [95.52–99.63] | 95.20 [94.97–96.62] | −1.96% | 96.57 → 97.73 | −2.96% |
| Redis · Standalone Asio · 1 KiB pipeline64 · window1 · 4 clients |
365.97 [363.32–385.05] | 368.73 [363.17–376.57] | +0.75% | 102.34 → 103.23 | −0.88% |
| WebSocket · Boost · 64 B window16 · 4 workers · 16 clients |
236.16 [210.92–237.84] | 233.98 [232.33–234.42] | −0.92% | 366.14 → 368.33 | −1.55% |
| WebSocket · Boost · 4 KiB window16 · 4 workers · 16 clients |
159.67 [147.66–161.17] | 149.27 [139.90–156.68] | −6.51% | 372.05 → 369.21 | −5.79% |
| Redis · Boost · 4 KiB pipeline16 · window1 · 4 clients |
95.47 [95.05–99.16] | 95.46 [95.36–97.58] | −0.01% | 97.28 → 97.38 | −0.08% |
| Redis · Boost · 1 KiB pipeline64 · window1 · 4 clients |
365.88 [363.26–375.79] | 367.87 [363.90–374.77] | +0.54% | 102.30 → 102.76 | +0.18% |
| TCP · Boost · 64 B window16 · 4 workers · 16 clients |
315.96 [272.55–317.00] | 311.26 [267.16–314.56] | −1.49% | 359.25 → 361.72 | −1.98% |
| HTTP · Boost · 4 KiB window16 · 1 worker · 16 clients |
53.21 [53.06–53.80] | 53.12 [52.71–53.39] | −0.17% | 82.15 → 82.26 | −0.30% |
Latency (µs)
Redis measures the entire pipeline batch; public endpoints measure a single message roundtrip.
| Configuration | Baseline P50 | Candidate P50 | Baseline P99 | Candidate P99 |
|---|---|---|---|---|
| Redis · Standalone Asio · 4 KiB | 661.00 [638.50–669.96] | 671.96 [665.25–672.46] | 711.00 [707.17–722.63] | 715.92 [712.71–730.25] |
| Redis · Standalone Asio · 1 KiB | 699.67 [663.42–703.92] | 695.83 [674.38–704.46] | 749.67 [719.71–755.96] | 750.08 [743.58–754.58] |
| WebSocket · Boost · 64 B | 1086.79 [1080.71–1226.83] | 1097.04 [1095.58–1105.42] | 1310.71 [1299.83–1412.96] | 1316.29 [1297.46–1330.38] |
| WebSocket · Boost · 4 KiB | 1581.50 [1570.83–1713.96] | 1632.58 [1617.46–1811.17] | 1990.00 [1900.25–2232.42] | 2254.42 [1993.67–3181.96] |
| Redis · Boost · 4 KiB | 670.54 [640.75–673.13] | 670.79 [657.71–671.25] | 713.38 [706.63–716.67] | 711.92 [709.38–713.25] |
| Redis · Boost · 1 KiB | 700.38 [676.92–704.42] | 697.83 [681.42–703.00] | 750.42 [743.63–755.42] | 747.83 [744.00–750.38] |
| TCP · Boost · 64 B | 806.17 [804.25–952.71] | 820.88 [815.21–967.88] | 1124.96 [1115.63–1180.96] | 1131.50 [1094.21–1238.42] |
| HTTP · Boost · 4 KiB | 4779.29 [4738.50–4794.00] | 4804.46 [4786.33–4821.88] | 5082.04 [5053.21–5111.67] | 5124.08 [5079.75–5128.21] |
Measurement environment
Apple M4 Pro (Mac16,11), 14 cores, 48 GiB; macOS 27.0.1 (26A434); Apple Clang 21, -O3 -DNDEBUG -std=gnu++20; Boost 1.90, Standalone Asio 1.38.2 and OpenSSL 3.6.4. All configurations use plaintext IPv4 loopback. The Redis-protocol server is Valkey 8.0.11. Interval: 2026-10-15 19:36:55–19:45:00 UTC.
Baseline 25fe2e5fac4e09edee597f312d58b0362b9e0681, candidate 2aa5bc0ef7d383d8cfbc04520f3b952fa27c5fbd, using identical formal C++ benchmark drivers. Redis uses four connections, one context/worker per connection and one in-flight batch. Public endpoints use 16 connections, window16 and one shared context, with four workers except HTTP (one). This comparison covers callbacks, not pools, coroutines, shutdown duration or deployment capacity.
Reproduce
Shared-driver build · Database configuration grid · Transport configuration grid